What goes into the making of a really great animated movie? Here, I consider two things:
- Is the movie visually appealing?
- Does the movie tell a compelling story?
I looked at the composition of movie crews for the highest grossing movies from Pixar/Disney and Dreamworks Animation (the top production studios according to IMDb). First I compared whether visual effects or animation dominated the movie's visual art. Modern animated movies have crews with large teams dedicated to both visual effects and animation, but production studios have a choice regarding which team deserves more resources.
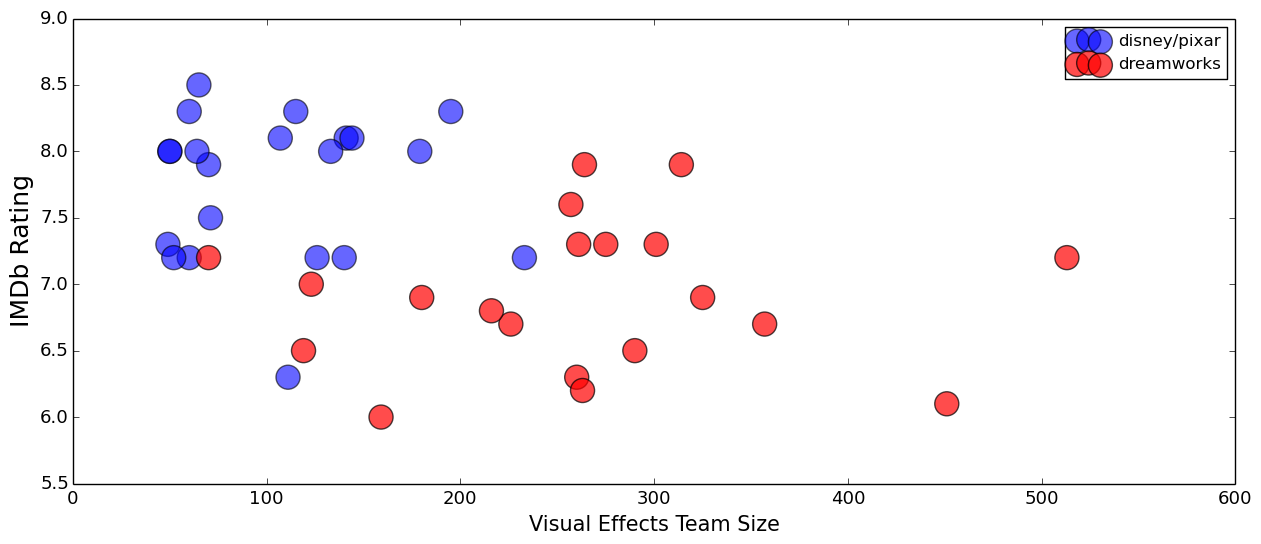
Dreamworks invests in visual effects more so than Pixar/Disney. However, it appears that high-rated movies do not require substantially large teams dedicated to visual effects. The top Pixar/Disney movies achieve high IMDb ratings, but their visual effects teams are no more than twice the size of their animation teams. In contrast, Dreamworks movies are typically made with twice as many crew members dedicated to visual effects than to animation.
Next I compared who wrote and produced these movies. Since I wanted to measure whether a movie had 'experienced' writers and producers, I added up the total number of movies each writer and producer had ever written or produced (respectively) and summed these values for all writers and producers involved in each movie. As shown below, Pixar/Disney has more experienced writers and producers than Dreamworks.
So what factors set apart great movies from bad movies? Well, Dreamworks isn't sacrificing the number of animators involved in their movies by replacing them with visual effects crew members. Rather, Dreamworks just hires larger visual effects teams than Pixar/Disney. I speculate that having a large visual effects team doesn't hurt a movie ... but it doesn't help with ratings either. Therefore, great movies must be driven by experienced writers and producers. It makes sense that experienced writers craft more compelling stories, or that successful writers are in higher demand and, thus, have more experience!
Thank you for taking an interest in this project. If you want to learn more about resource allocation in animated movies, then please read on for more detail.
ADDITIONAL TECHNICAL DETAILS, STARTING WITH MY PROJECT MOTIVATION
I was really curious to understand why I like Pixar movies so much. I wasn't sure if it's because they look good or because the dialogue is often very funny with creative storylines. I also wanted to understand why I don't really like Dreamworks movies. The internet movie database (IMDb) is full of information on movies and their cast and crew teams, and so I dug into this data to figure out what was going on behind the scenes!
Before I start to compare Pixar/Disney and Dreamworks, I want to show how resource allocation in animated movies has evolved over time. The interactive plot below allows you to click through year 1980 to 2016, in order to visualize IMDb rating versus crew size as a function of time. Colors represent specific teams making up the crew, such as the animation team, visual effects team, and writing team. Bubble size indicates relative movie gross.
DYNAMICS OF THE ANIMATED MOVIE INDUSTRY
The most obvious result is the increase in crew size and film gross over the years. Movies that invested in large animation teams (and bigger crews) in the 90s usually made more money and had higher IMDb ratings. Around year 2000, visual effects are introduced in animated movies. Mouse over the bubbles to see that the movie Shrek, which was released in 2001, had a visual effects team that was much larger than its animation team. After year 2000, you can see some competition between the animation team size and the visual effects team size. Some movies invested more crew in animation, while others invested in visual effects. Another interesting find is that film gross and IMDb rating are only correlated with crew size up to a certain point. Take a look at year 2006: the movie Happy Feet had nearly 1000 crew members but it's IMDb rating was around 6.5. In contrast, the movie Cars (also released in 2006) had only 500 crew members but it's IMDb rating was over 7. Although the difference is only 0.5, most high-grossing animated movies score between 6 and 8 (which is a pretty tight range).
VISUAL EFFECTS: QUANTITY DOES NOT IMPLY QUALITY
To visualize the competition between animation and visual effects, I calculated the ratio of visual effects team size to animation team size. My plots focus on Pixar/Disney and Dreamworks because those studios produced several of the highest grossing films. Furthermore, I wanted to address the basis for my project motivation: 'Pixar versus Dreamworks.'
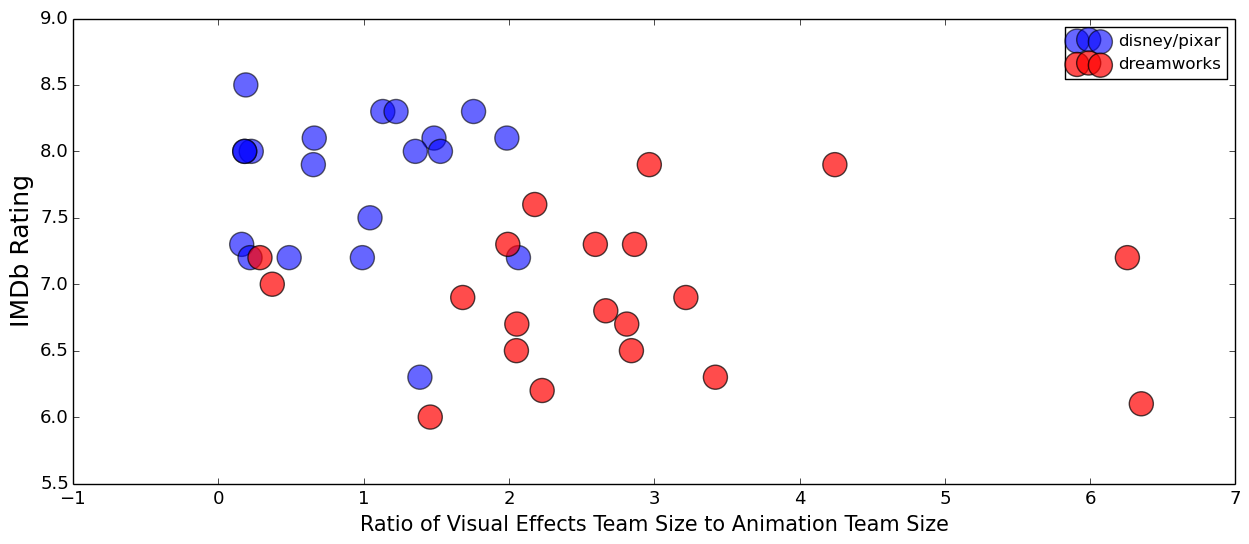
As summarized earlier, Dreamworks invests more resources in their visual effects teams. Unfortunately, having more crew members dedicated to visual effects does not result in higher IMDb ratings.
VISUALIZING CONNECTIONS BETWEEN MOVIES BASED ON THEIR WRITERS
I created several network graphs to understand how movies were related to each other based on their writers. The graph below displays Pixar and Disney movies in blue, and the writers in purple. To make it easier to identify the most influential writers, I removed writers who were only involved in a single movie.
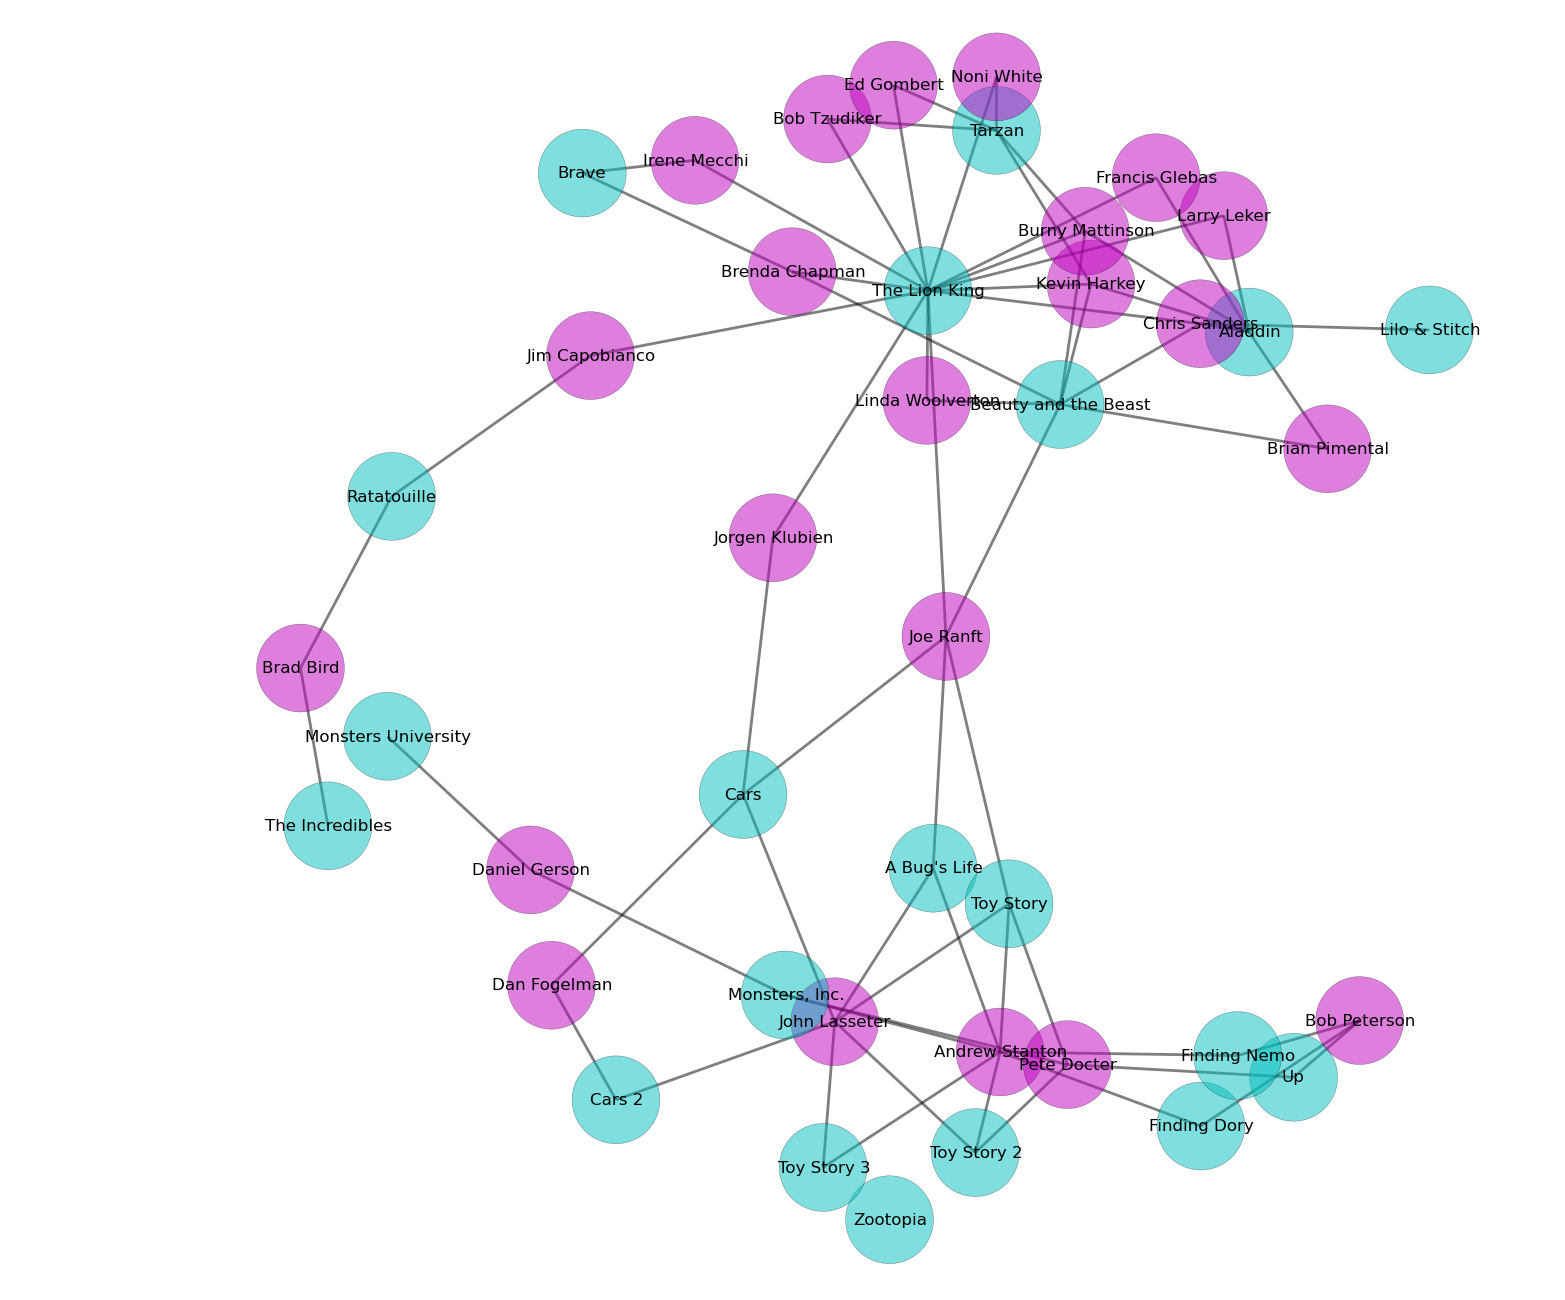
It's interesting to see that the graph has a noticeable division between Disney movies (on top) and Pixar movies (on bottom). Jim Capobianco, Jorgen Klubien, and Joe Ranft are the only writers connected to both Disney and Pixar movies. It's also interesting to see that Toy Story is connected to 4 experienced writers, Toy Story 2 is connected to 3 experienced writers, and Toy Story 3 is connected to only 2 experienced writers. In other words, Pixar appeared to invest more resources in the first Toy Story, and less resources in its sequels. This was also true for the Cars movies and the Monsters Inc movies. The network graph for DreamWorks Animation movie writers is shown below.
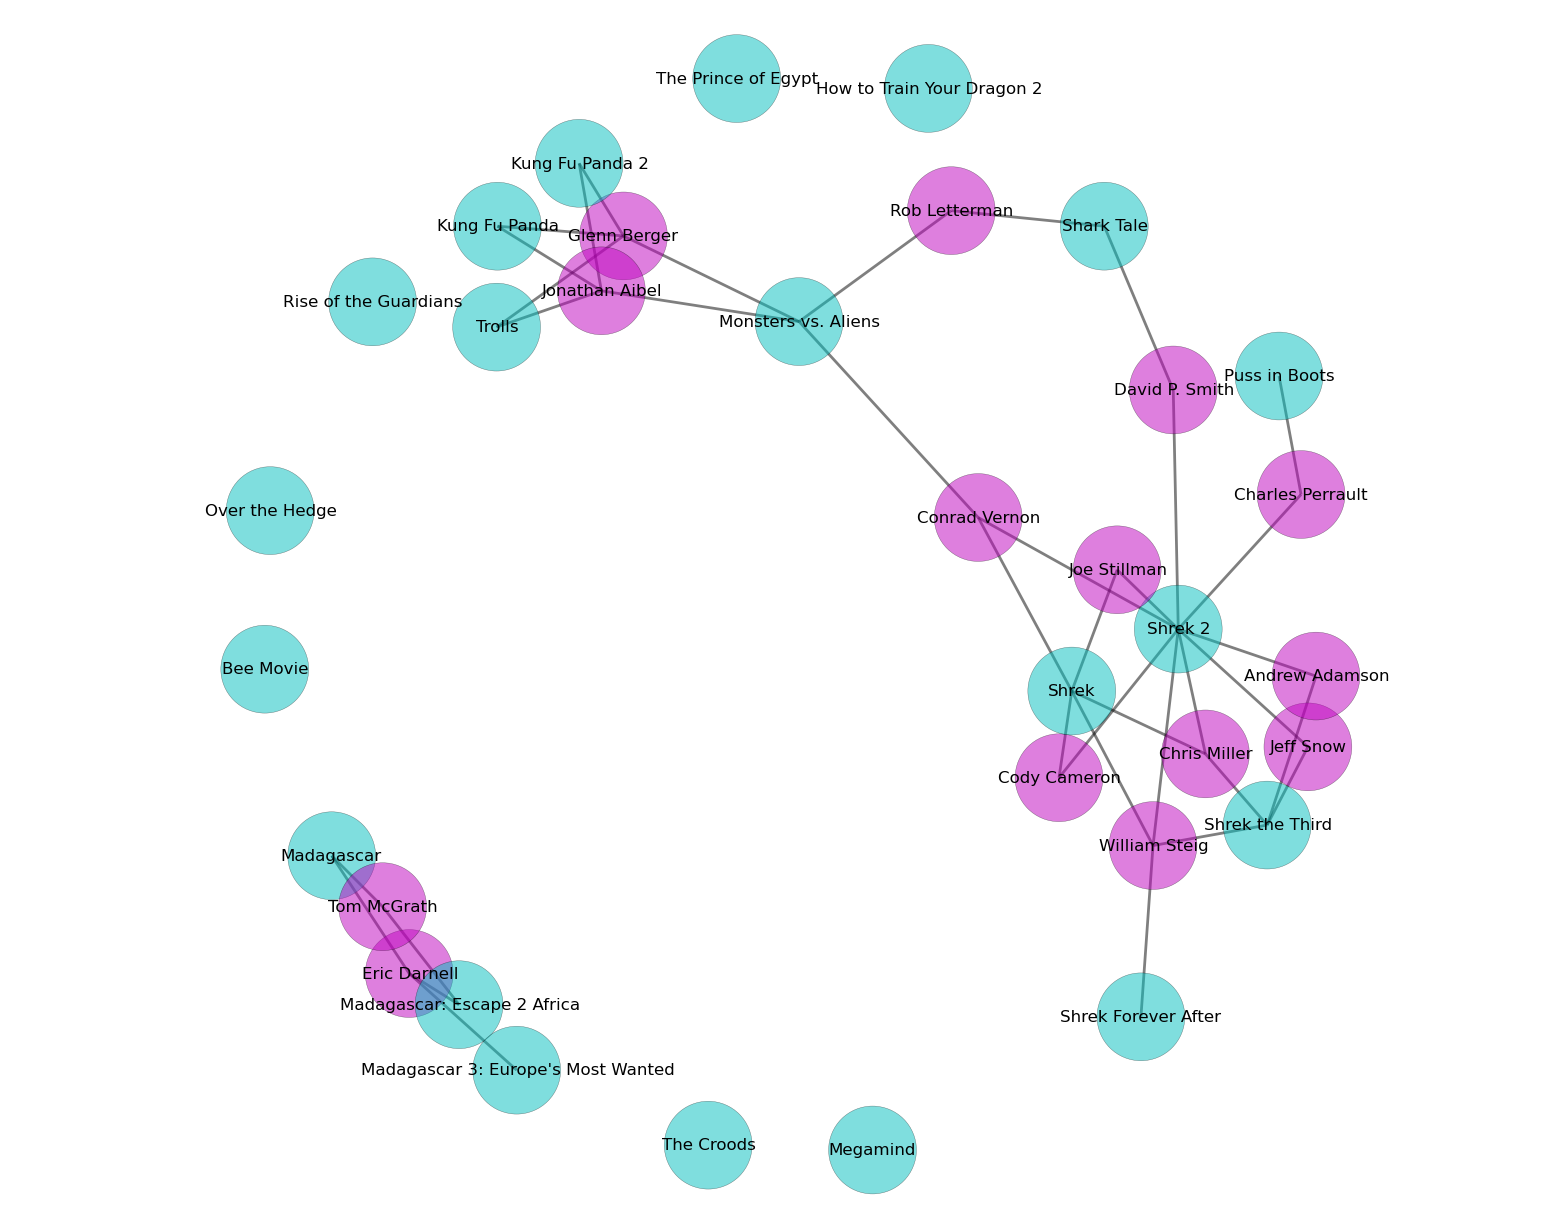
In comparison to the Pixar/Disney movies, there appears to be less connections among DreamWorks movies, and more segregated clusters of movies. The Shrek and Madagascar movies represent two obvious clusters, where the writers were not very involved in writing movies outside of their clusters.
SCORING WRITERS, PRODUCERS, AND DIRECTORS
Based on the network graphs, I developed a scoring metric to reflect a writer's experience. I call this metric "writers score" and it is calculated by assigning each writer a value according to how many movies he or she has ever been involved in, and then summing these values for all writers in a given movie. In the same manner, I also determined the directors score and the producers score for each movie.
I used a pearson correlation matrix to quickly judge which features were predictive of IMDb rating, movie gross, and number of IMDb ratings. Pearson's correlation coefficients measure the linear dependency of two variables. In the matrix below, 'ratio' is the size of the visual effects team divided by the size of the animation team. Red corresponds to a positive correlation and blue corresponds to a negative correlation:
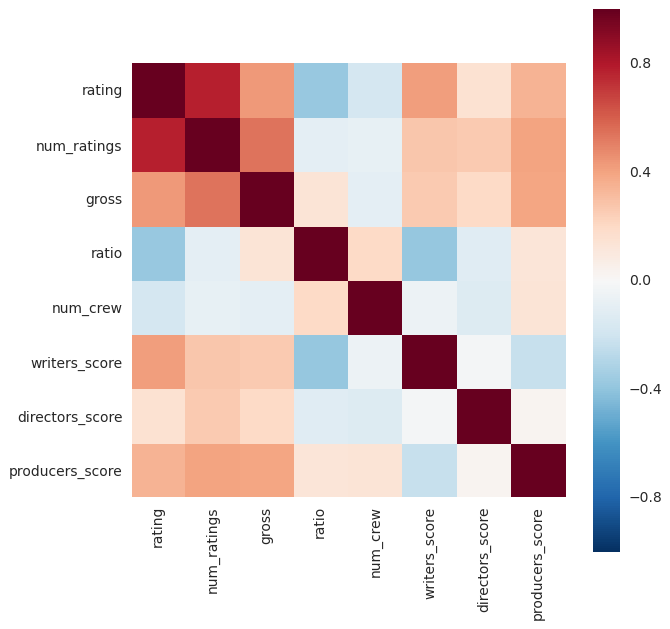
Note that the IMDb rating is correlated with num_ratings (the number of IMDb ratings) and movie gross, which is to be expected. Interestingly, the number of total crew involved did not heavily correlate with movie rating. The director's score also did not strongly correlate with IMDb rating. On the other hand, the writers and producers score correlated with IMDb rating, and the ratio metric had an inverse correlation.
QUALITY OVER QUANTITY
To evaluate story quality, I lumped the writers score and the producers score together (by adding them together). Shown below is the plot comparing IMDb rating for Pixar/Disney movies and DreamWorks movies. As noted earlier, Pixar/Disney has more experienced writers and producers than Dreamworks.
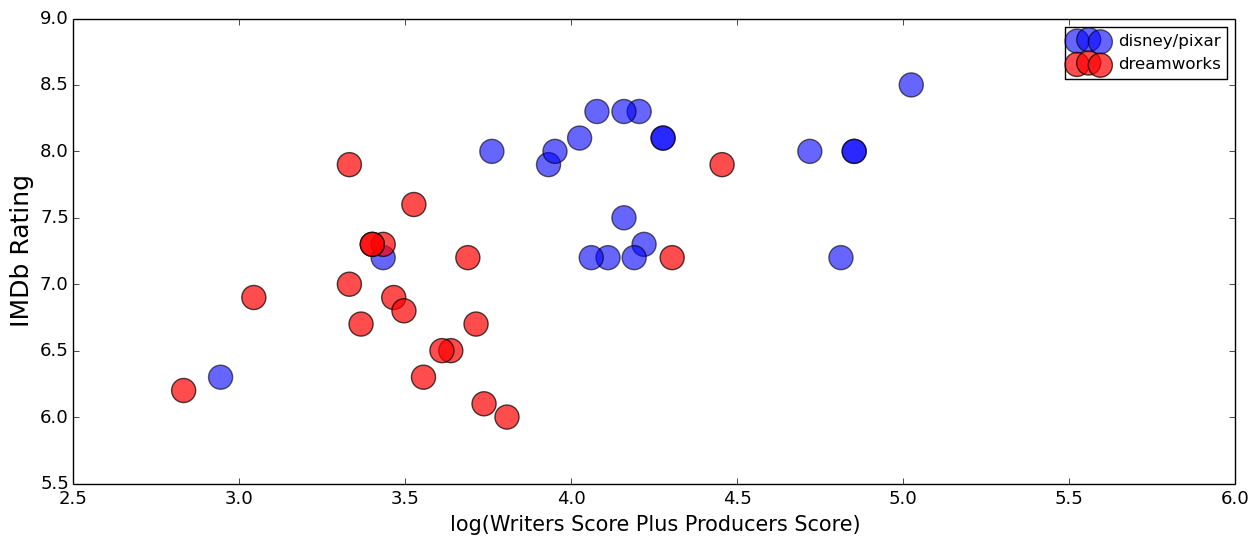
By definition, the writer/producer scores are affected by the number of producers and writers in the movie, so I also looked at team sizes for these features. Pixar/Disney and Dreamworks both had 1 to 13 writers per movie (with some exceptions: Lion King, Aladdin, and Tarzan each had 20+ writers). Within this range, the number of writers per movie had no impact on IMDb rating. Regarding producers, Pixar/Disney had 2 to 6 producers per movie, while Dreamworks had 2 to 11 producers per movie. Thus, the average number of producers per movie was higher for Dreamworks than for Pixar. Regardless, the number of producers did not impact IMDb rating. These results indicate that the writer's experience not the size of the writing team impacts the IMDb rating (and same goes for the producers involved). In other words, writer/producer quality is more important than the number of writers and producers involved.
METHODOLOGY and TOOLBOX
I used the BeautifulSoup package in Python to scrape movie data off of the internet. I started by scraping wikipedia to get a list of all animated films released since 1980. I found approximately 2000 animated movies released since 1980. Using this list of movies, I scraped IMDb (the internet movie database) to get data on movie rating, year of release, film gross, production studio, details on the full cast and crew, and more. IMDb only had results for about 1000 movies from my original list of 2000 movies. Most of the missing movies were small, foreign films. The following diagram illustrates the steps I took to gather my data:
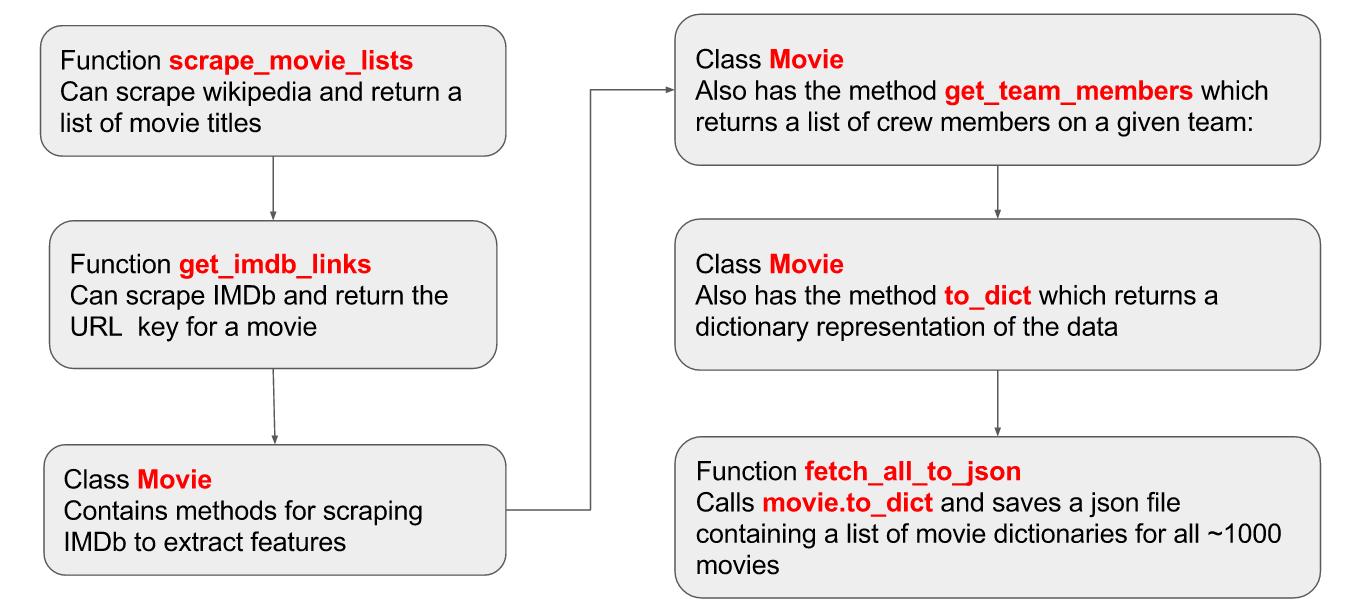
The github repo for this project can be found here: github.com/irenium/IMDB_scraping